Recent News
The NGDF tool can now be referenced as Yang, Wang and Ji, Contemporary Clinical Trials, 45 (2015) 426–434. Oct 12, 2015
read more…
What is NextGen-DF
NextGen-DF is a web-based statistical tool for designing phase I dose-finding trials in oncology. It assumes that a fixed number of doses is predetermined and allows users to evaluate three designs by running computer simulations. The three methods are the 3+3 design, the CRM design, and the mTPI design. NextGen-DF provides mTPI designs (Ji et al., 2007, 2010; Ji and Wang, 2013) as the main recommended method, as it has been shown to be safer and more efficient than 3+3, and more intuitive and less burdensome than CRM. NextGen-DF is divided into three main components as shown in the menu bar: DECISION, SIMULATION, COMPARISON. read more…
In DECISION, mTPI designs will be generated as a two-way table, which provides all the dose-finding decisions pre-calculated based on the original method in Ji et al. (2010). This table can be calibrated as each entry of the table can be modified by clicking with a mouse on a computer or tapping on a tablet or smart phone. After such calibration, users will obtain a customized mTPI design that is close to the calibrated design as well. Also provided in DECISION is a tool for estimating the MTD (Maximum Tolerated Dose) given trial data. The tool is self-explanatory.
In SIMULATION, users will be allowed to set up simulation scenarios in three ways (Manually input, Batch input, Automatically input), under which the four designs (mTPI, 3+3, CRM, customized decision) can be performed to simulate trials separately.
In COMPARISON, simulation results comparing any two designs will be displayed with figures and tables. Results will be available instantaneously because we put substantial effort in optimizing the computer programs. But the computational time for comparison related to CRM is much longer than others, since we incorporate an R package for running CRM. In most cases the computation should be finished within minutes. read less
[ Quick Start Guide ]
Comparison between mTPI and 3+3 in 42 scenarios described in Ji and Wang (2013)
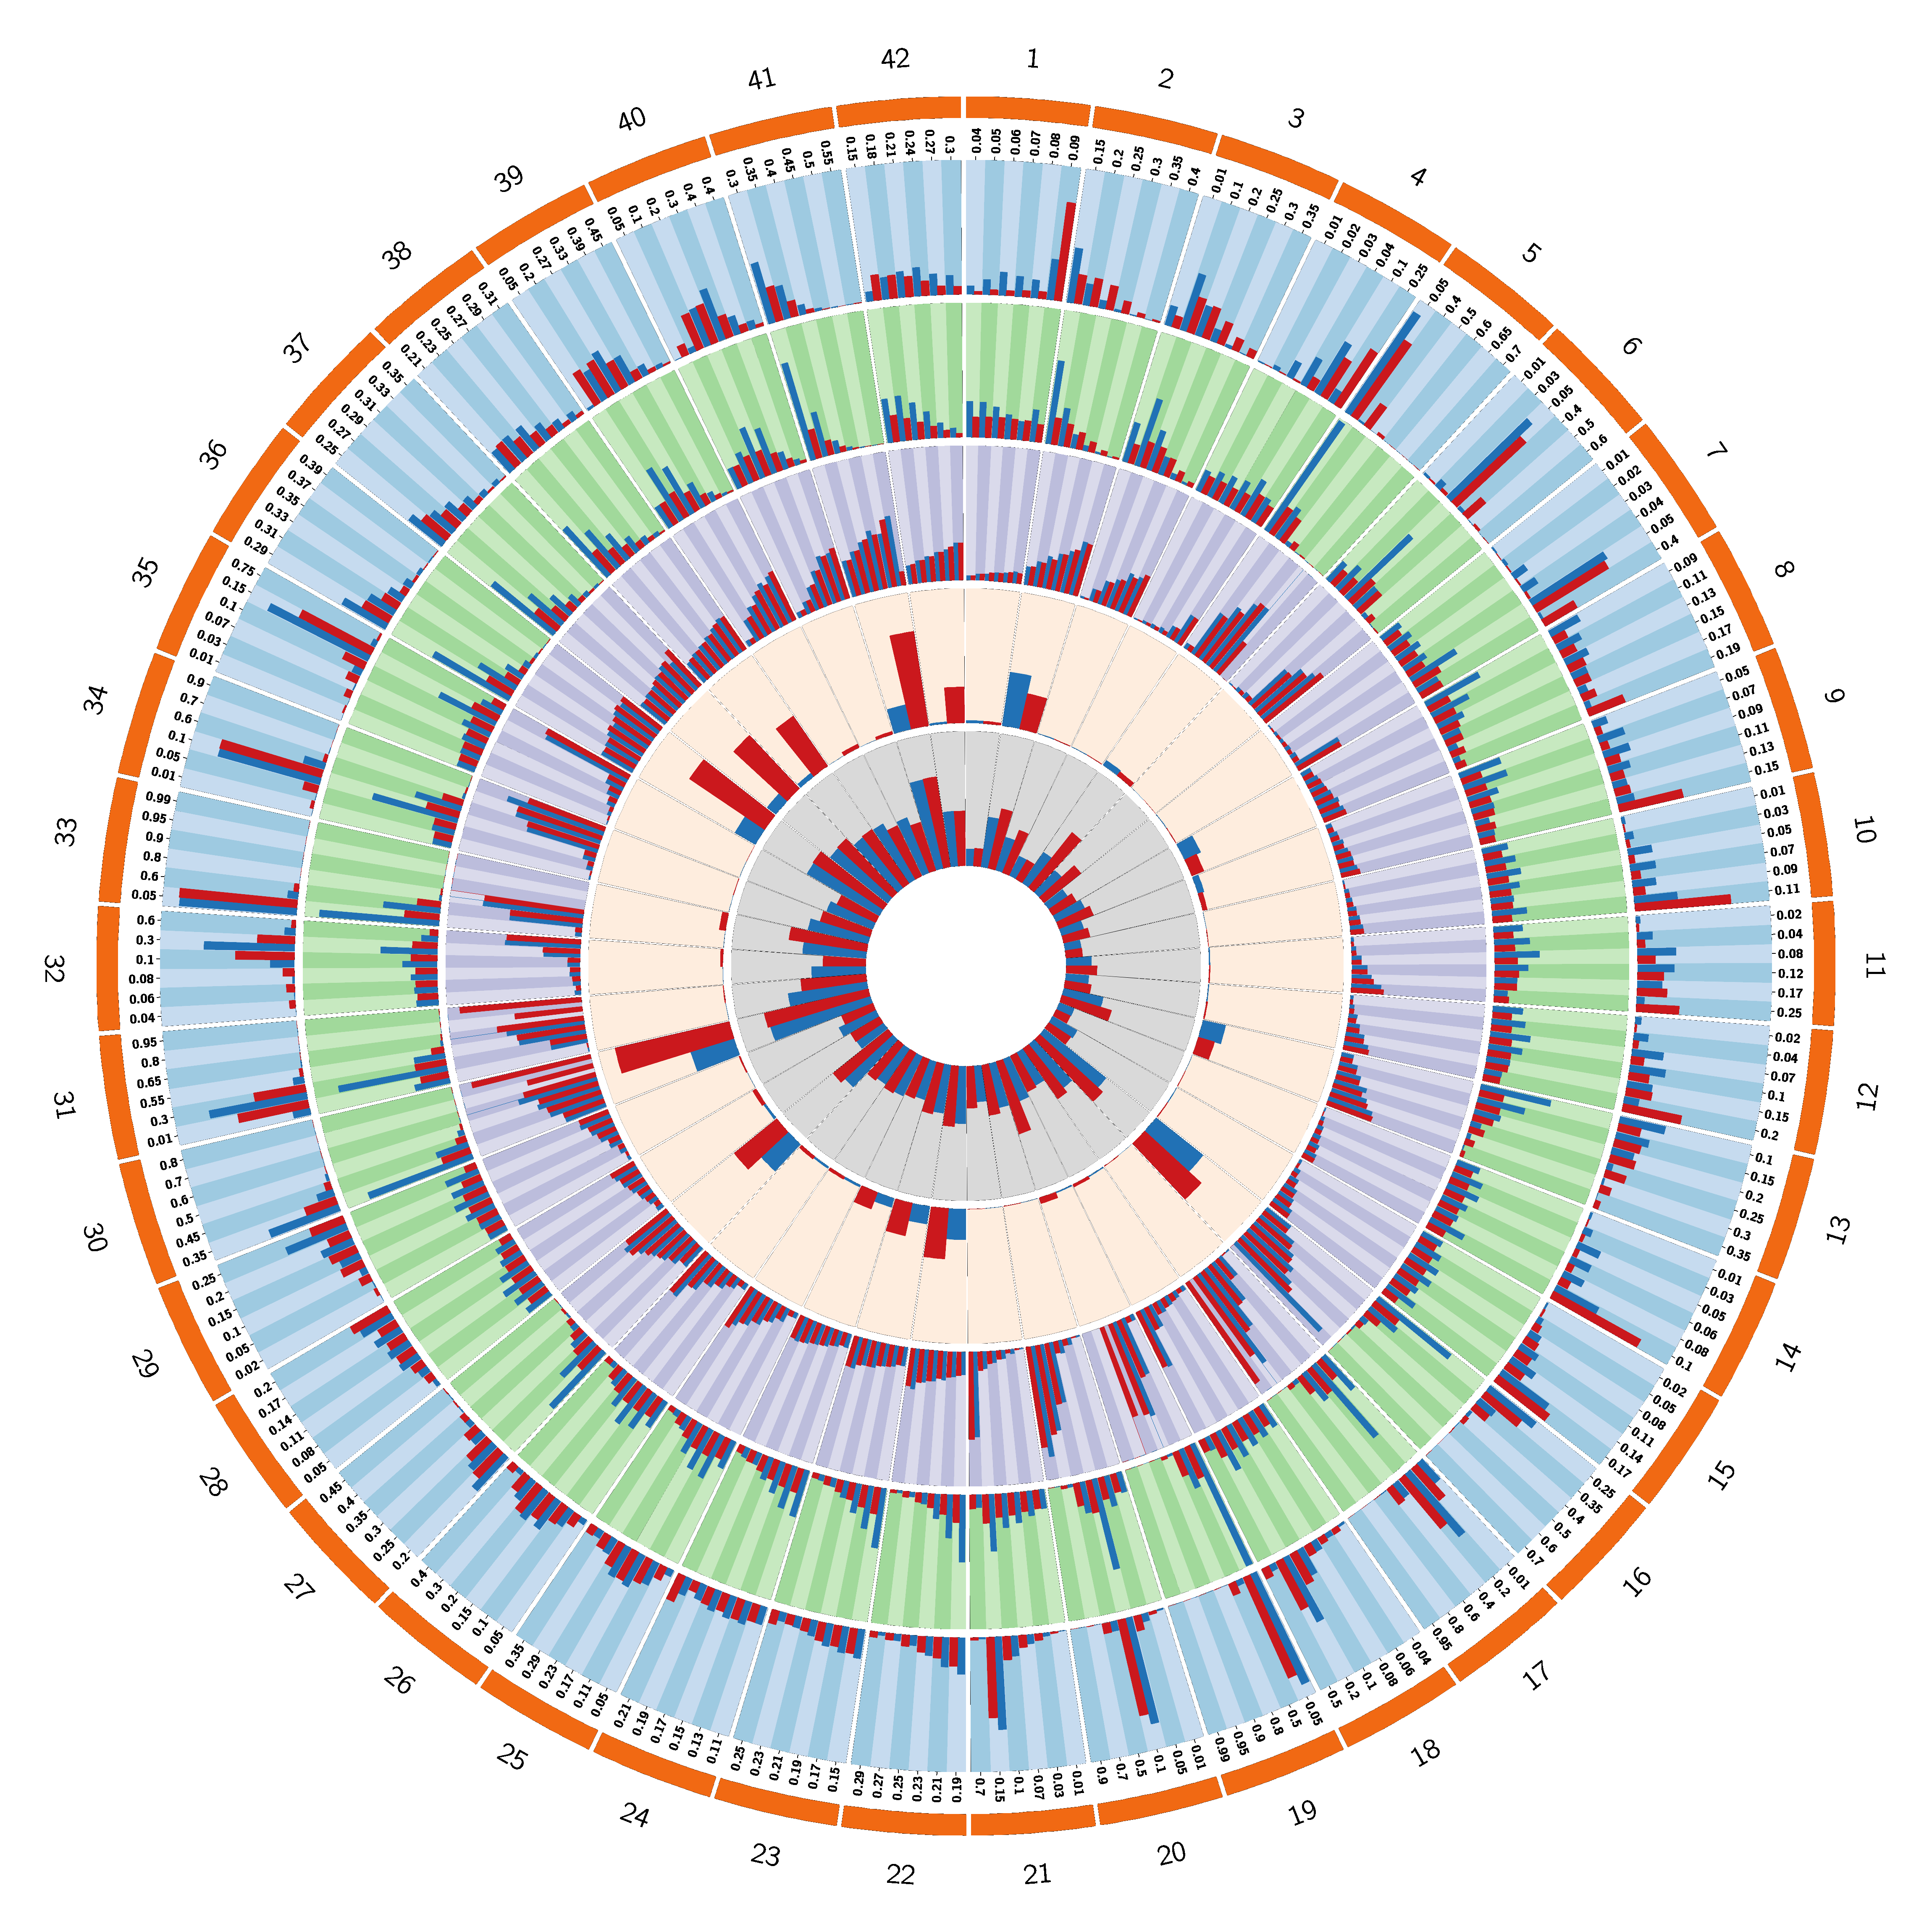
Blue Bar : mTPI
Red Bar : 3+3
1st Track : % of selection
2nd Track : # of treated
3rd Track : % of toxicity at each dose level
4th Track : % of early stop
5th Track : % of toxicity per trial
Please Cite:
Shengjie Yang, Sue-Jane Wang and Yuan Ji. "An integrated dose-finding tool for phase I trials in oncology."
Contemporary Clinical Trials, 45 (2015) 426–434.
DOWNLOAD PDF
We recorded simulated trials and results conducted by NextGene-DF users and incorporated the results into a database (Data collected from Apr 2014 till Dec 2014 and click here to download the raw data). The database consists of results for 3+3, CRM and mTPI based on 1,275 different scenarios and 4,327,385 simulated trials. To our knowledge, this is the largest study evaluating the three designs to date. In each scenario, users specified a number of doses and a set of true toxicity probabilities for all the doses, generated toxicity response data based on the true toxicity probabilities of the doses, and conducted trials on computer using each of the three designs. At the end of simulation, users summarized the operating characteristics of the three designs and compared their performance. We summarize the pairwise comparisons of mTPI, 3+3 and CRM (see the figure below). In all boxplots, a higher than zero value indicates that the first design of the pair has a better performance. For example, the far left boxplot implies that mTPI is more reliable in finding the true MTD than 3+3. Examining all six boxplots, it is clear that mTPI is the most desirable design with higher reliability and safety and 3+3 is the least desirable design.
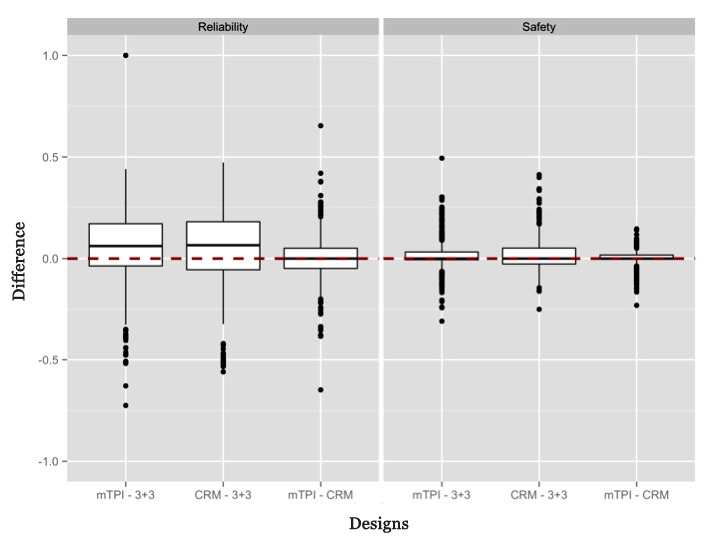
. Boxplots of pairwise differences in reliability and safety for the three designs, 3+3, CRM, and mTPI. The reliability is calculated as the average percentage of selecting the true MTD across simulated trials for a given scenario. The safety is calculated as the average percentage of patients treated at or below the MTD across simulated trials for a given scenario. Each barplot summarizes the differences of reliability or safety between two designs, in the form of design A minus design B. Therefore, if the value is above zero, the first design of the pair has a better performance. For example, the far left boxplot implies that mTPI is more reliable in finding the true MTD than 3+3.